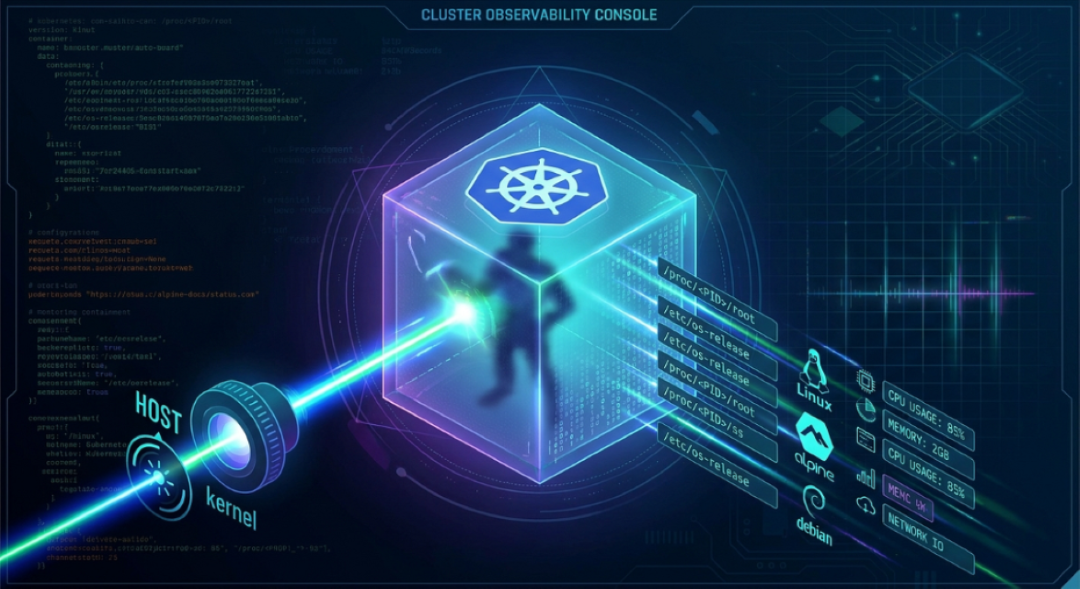
Observability is what turns Kubernetes from a black box into a platform you can operate with confidence. Without it, teams struggle to answer simple questions such as whether a rollout caused latency, which service is saturating, or whether a node is failing under load.
1. Instrument every layer
Metrics, logs, and traces should all be collected from applications, infrastructure, and the control plane. A healthy observability stack combines service-level metrics for user impact with low-level signals for debugging and capacity planning.
2. Standardize labels and naming
Useful telemetry depends on consistent labels such as app, environment, team, and release. When every service uses the same conventions, dashboards and alerts become easier to maintain and less noisy.
3. Alert on symptoms, not just infrastructure
Good alerts capture customer impact and service health rather than isolated metric thresholds. A rise in error rate or latency usually matters more than a temporary spike in CPU usage on a single pod.
4. Build dashboards around user journeys
Dashboards should reflect how users experience the service, from API latency to dependency health. When SRE and engineering teams use the same views, incident response becomes faster and more consistent.